


Insights
News 2024.06.03
Glassdome selected as organizer of new Global Battery Alliance Digital Battery Passport Pilot
Consortium of 13 companies, including Samsung SDI, SKIET, EcoPro, Lotte Infracell, and SK C&C, formed to respond to EU Battery Directive
Pilot project launched in May 2024 to establish systems, inspect companies’ regulatory response processes, and prepare for 2027 implementation of digital battery passport requirements
Vancouver, Wash., and Seoul, South Korea: Glassdome, a leading sustainability platform for manufacturers, was selected by the Global Battery Alliance (GBA) to organize a new Digital Battery Passport pilot project. The choice was revealed in an announcement on May 21, 2024. Glassdome has formed a consortium of 13 companies, including Samsung SDI, SK IE Technology (SKIET), EcoPro, and Lotte Infracell, and will lead a pilot program designed to preemptively respond to upcoming EU Battery Directive Digital Battery Passport requirements.
The Digital Battery Passport is a system that tracks, manages, and provides access to full lifecycle and sustainability data for EV and industrial batteries over 2kWh distributed in the EU. The EU Battery Directive requires its implementation by February 2027. To comply, battery manufacturers and suppliers need to collect and manage key data like their product carbon footprint (PCF), percentage of recycled materials, and country of origin.
The Glassdome platform helps companies report their PCF using real data. Carbon compliance and global environmental regulatory reporting are often a complex, time consuming process. Glassdome makes sustainability simple for manufacturers by guiding them from data collection to monitoring to ongoing reporting.
This year, Lloyd's Register Quality Assurance (LRQA) named Glassdome as the first ISO 14067 verified real data PCF platform. When a company measures and reports their PCF through Glassdome, its results already comply with ISO 14067 standards, shortening the verification period by weeks and cutting costs.
The GBA was established at the World Economic Forum in 2017 through cooperation between battery producers, mining and energy companies, and government agencies. The Digital Battery Passport initiative helps it achieve its goal of a carbon neutral battery value chain by 2050.
The GBA pilot project led by Glassdome will derive accurate real-data-based PCFs across the entire battery manufacturing lifecycle. It will also implement a secure data management system that helps manufacturers and partners share only their relevant PCF data, and only with those who need to know it.
The full consortium consists of:
- Glassdome
- Samsung SDI (battery manufacturer)
- SKIET (separator)
- EcoPro (cathode material)
- SK Nexilis (copper foil)
- Lotte Infracell (aluminum foil)
- Choil Aluminum (aluminum foil)
- Inzi Controls (battery module manufacturer)
- SK tes (waste battery recycler)
- PM Grow (battery subscription service and reusable battery company)
- Future Battery Industries Cooperative Research Centre (Australian battery research center)
- Korea Battery Industry Association (Korean battery trade association)
- SK C&C (digital carbon passport platform company)
Jinki Ham, CEO of Glassdome Korea, remarked, “As we transition from a linear to a circular economy, the global market needs environmental impact data. Sustainability regulation is changing the disclosure of information like recycling rates and product carbon footprint from a nice-to-have to a must-have.”
He continued, “Glassdome is a world leader in carbon regulation solutions. We’re dedicating ourselves to helping our manufacturing clients, large and small, continue to export to customers in Europe and anywhere else carbon regulation emerges.”
Lee Jeong-hoon, head of the SK C&C Net Zero Platform Business Team added, “Digital and ESG expertise based on LCA foundations is essential in tracking carbon data in the battery value chain. By combining that expertise with generative AI technology, we will go beyond simple data tracking and make our customers more competitive by helping them reduce their carbon footprints.”
Under Glassdome’s leadership, a total of 13 battery value chain companies from Korea, the U.S., and Australia will form the GBA consortium and promote the ‘Digital Battery Passport’ pilot project from May 2024.
About Glassdome: Glassdome is an industrial software company dedicated to making sustainability and operations clear and simple for manufacturers. The company was founded in the innovative heart of San Francisco in 2019. Roots in Silicon Valley and Korea connect a tech-savvy spirit with powerful industrial expertise. The Glassdome platform is uniquely positioned to serve manufacturers that want to improve efficiency and meet and exceed green regulation requirements, all in one platform.
Find out more at glassdome.com.
PCF 2024.05.30
Three Common Product Carbon Footprint Pain Points
The world is slowly coming to terms with the impact carbon emissions have on climate. At the COP28 UN Climate Change Conference, the gathered nations agreed to “transition away from fossil fuels,” a major milestone for an event hosted by the United Arab Emirates. But acknowledging the problem is not enough.
Governments are taking actionable steps to reach the Paris Climate Agreement goal of “substantially [reducing] global greenhouse gas emissions to hold global temperature increase to well below 2°C above pre-industrial levels and [pursuing] efforts to limit it to 1.5°C above pre-industrial levels.” And that’s resulting in regulations like CBAM, California SB 253, and CSRD.
Most organizations are taking steps toward measuring greenhouse gas (GHG) emissions at the corporate level. But that isn’t granular enough to comply with these new, stricter targets. Organizations need to be able to measure impact at the product level and throughout their supply chain with a Life Cycle Assessment (LCA) or Product Carbon Footprint (PCF).
Your organization might already be embarking on an LCA or PCF. But before you begin, there are three challenges our PCF experts see every day that you should be aware of.
Data Availability
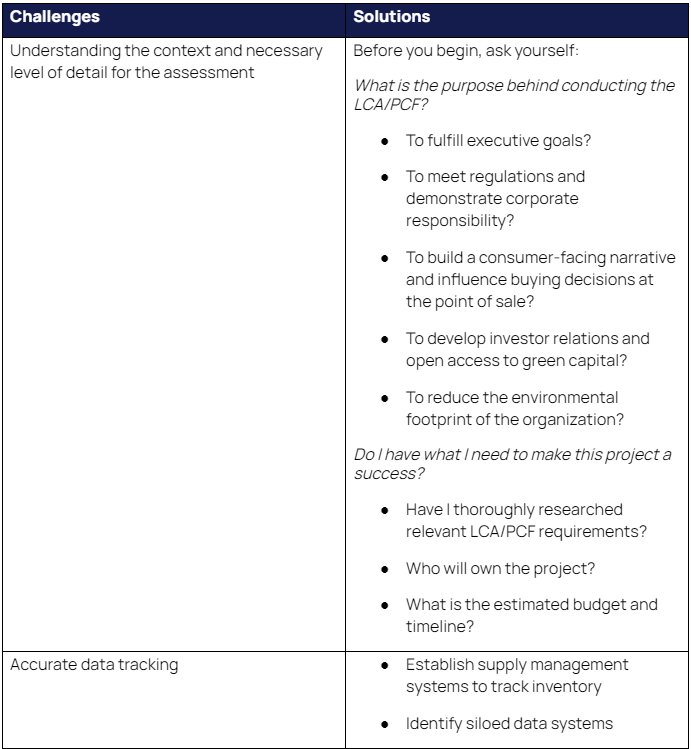
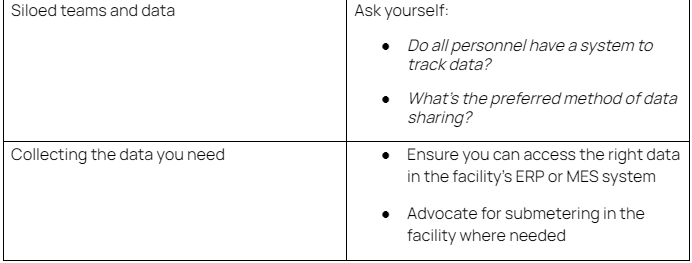
The challenges start at the beginning of the project. Just getting the data you need can feel overwhelming.
Data availability challenges can take a few forms, including understanding the context and necessary level of detail for the assessment, accurate data tracking, siloed teams and data, and collecting the data you need. The table below goes into further detail on possible solutions:
Data Quality
Not all data is good data. Your PCF data quality can be impacted by several factors, including:
- Scope: A well-defined and appropriately scoped LCA ensures accurate and relevant data. An inadequate scope may lead to incomplete or biased assessments.
- System boundaries: Defining clear and appropriate system boundaries is critical. Including or excluding certain processes can significantly impact results. Transparently documenting system boundaries helps ensure a reliable assessment.
- Data collection methods: Relying on incomplete sources or biased sampling compromises the reliability and representativeness of the data and influences the overall quality of the LCA results. Direct measurements and comprehensive surveys lead to higher accuracy and completeness.
- Data quality indicators: Indicators like reliability, representativeness, and precision help analysts assess and report the quality of the data used in the LCA or PCF.
- Data sources: High quality data comes from reliable and accurate sources. Using data from reputable and well-established sources (we often use ecoinvent) improves overall assessment quality.
- Data completeness: Incomplete data can lead to uncertain and inaccurate results. Make sure you cover all relevant stages of the life cycle, from raw material extraction to disposal.
- Data relevance: Make sure assessed data is relevant to the specific product or process being assessed. Using irrelevant or outdated data can compromise accuracy.
- Data uncertainty: Uncertainty comes with the LCA / PCF territory, and it's important to communicate the uncertainties associated with the data. Common techniques used in this process are sensitivity analysis and uncertainty analysis.
- Allocation methods: Allocation refers to how you distribute environmental burdens among different co-products or processes. The choice of allocation method will affect your results, and the method used should be justified and transparent.
- Temporal considerations: Changes over time, like technological advancements or shifts in energy sources, can affect environmental impact. Considering temporal aspects of data makes for a more accurate assessment.
- Geographical variability: Environmental conditions can vary geographically. Accounting for regional differences in data, especially for processes with location-specific impacts, enhances accuracy.
- Assessment methodologies: Your choice of impact assessment methodology (e.g., TRACI, ReCiPe, CML, Eco-Indicator) can influence the results. Different methodologies may yield vastly different environmental impact indicators.
Relying on Assumptions
It’s easy to lean on assumptions without even realizing you’re doing it. Unfortunately, assumptions can lead to incorrect impact assessments.
LCAs or PCFs can be based on assumptions for the following reasons:
Insufficient data is available: A minimum of one year of data is needed to conduct a LCA study.
Critical data hasn’t been tracked: Examples of data that is often not tracked include:
- Waste generated at a manufacturing facility and their method of disposal
- Water/wastewater treatment chemicals used at the manufacturing facility
- Support materials like grease
- Transportation distances for raw material and distribution
- Production allocation
Database categories don’t match your manufacturing process: Secondary databases contain commonly used materials and processes. When a manufacturing plant uses a complex chemical, it might not be present in the database. Which material or process in the database you choose to match to that complex chemical can impact your results.
Materials and processes in datasets are not present for the region of interest: For example, ethylene oxide production processes in North America, the World, and European Union may be present in the databases, but not for production of ethylene oxide in South Korea. This means the electrical grid mix to produce the ethylene oxide will not be representative of the grid mix in South Korea, leading to incomplete data.
How Can I Make These Pain Points Less Painful?
As you can probably tell by now, you’re going to need to spend a lot of time reviewing your data for completeness, quality, and relevance. And you’re going to need to make sure you’re using the right processes and methodologies to work with it.
You know what makes that easier? Working with experts.
With Glassdome, you’ll have consultants guiding you through data collection and helping you establish your data pipeline. And once the platform is set up, you’ll get monthly reporting to help you stay compliant and adjust as needed. It’s sustainability, simplified.
Get in touch with one of our PCF experts to learn more.

PCF 2024.05.22
Understanding GHG Emissions by Industry: A Comprehensive Analysis
Discover the impact of GHG emissions by industry with our comprehensive analysis. Learn about the key sectors contributing to climate change.
Industry has a large part to play in the fight against climate change. By proactively working to reduce their greenhouse gas (GHG) emissions, businesses can garner public support, stay compliant with government regulations, and help build a better future for everyone.
Which sectors are producing the most greenhouse gasses? Why are they contributing so much to climate change? And how can they clean up their act?
How do GHG emissions impact climate change?
The key greenhouse gasses causing climate change are carbon dioxide, methane, nitrous oxide, and fluorinated gasses. Human-produced CO2 is the largest contributor to global warming. Methane is more powerful than carbon dioxide but has a shorter lifespan in the atmosphere. Nitrous oxide works similarly to CO2 but is rarer.
Greenhouse gasses aren’t the only substances impacting climate change. Other pollutants like soot have their own effects on the world’s temperature. Solar radiation and volcanic activity can also cause long-lasting global climate effects.
Global greenhouse gas emissions by sector
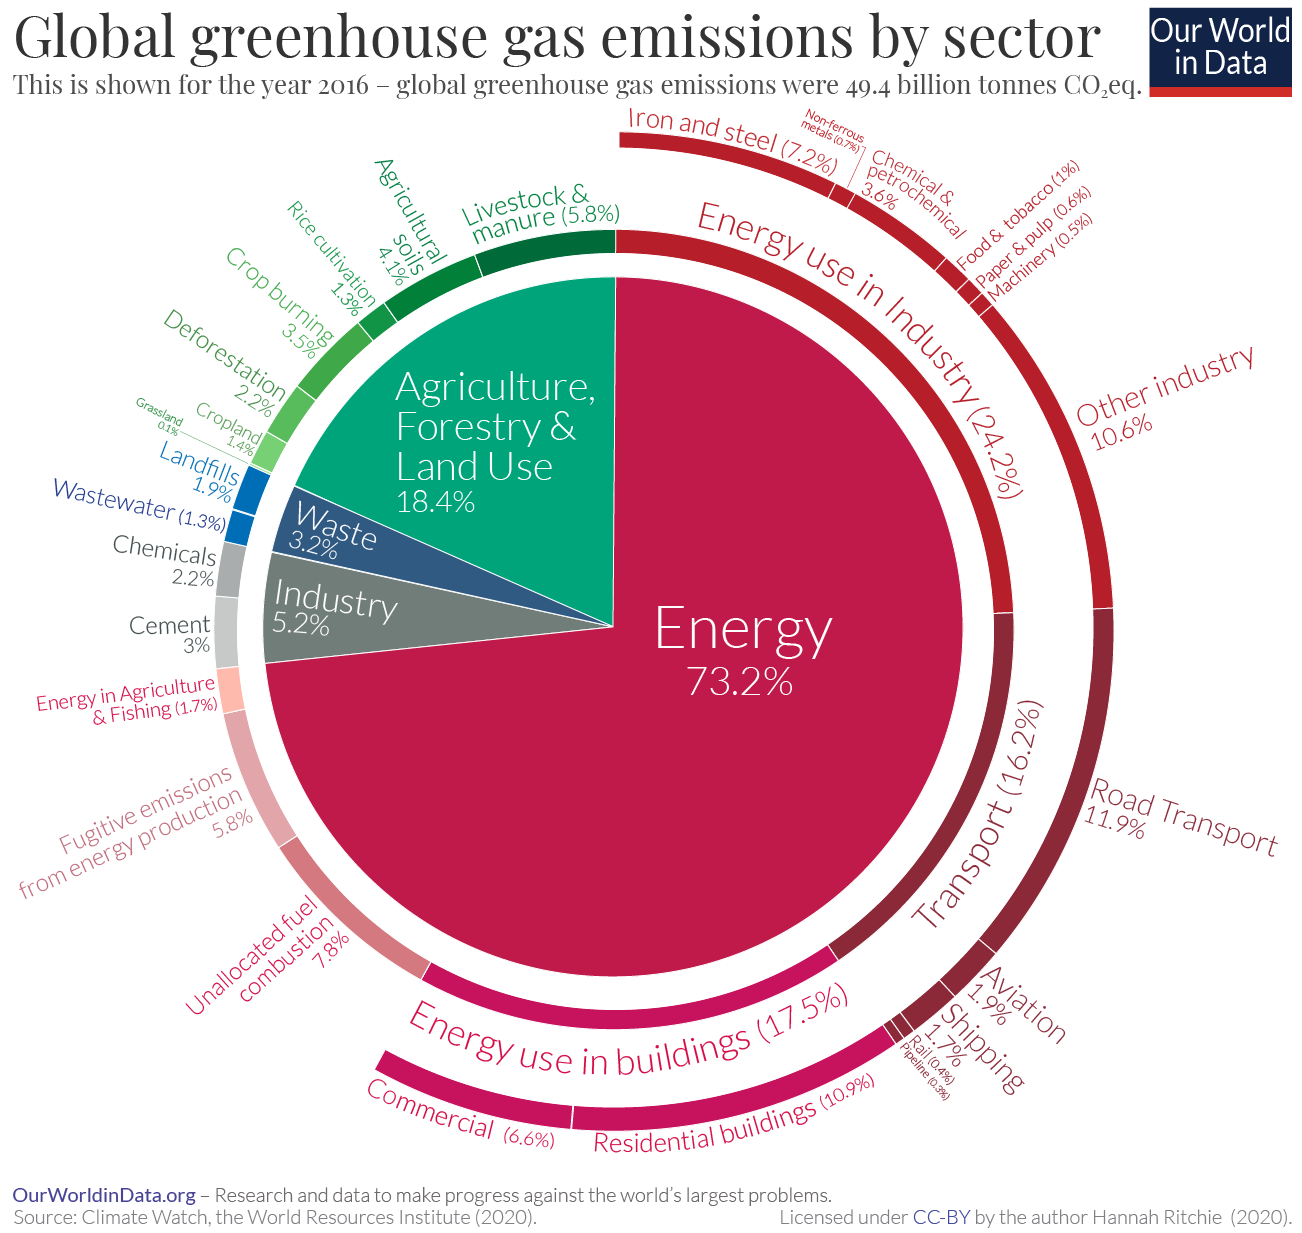
Source: Our World in Data
As you can see from the graph above, the vast majority (73.2%) of global greenhouse emissions are created in the energy sector. Agriculture, forestry, and land use are responsible for most of the remainder (18.4%), and industry and waste management account for most of the rest.
In this guide we’ll dive into each major source of GHG emissions. Let’s get started.
Energy
It makes sense that energy produces the majority of GHG emissions. Burning fuel to make heat alongside a polluting byproduct is at the core of many of the most common and cost-effective forms of energy generation like coal and natural gas.
Let’s take a closer look at how each sector creates emissions through their energy usage.
Energy use in Industry
Energy use in iron and steel production
Turning raw materials into iron and steel is an incredibly energy-intensive process, responsible for around 7.2% of global GHG emissions. It is also core to producing many of the products and services that humanity relies on.
Primary steel (fresh, unused steel) is made in a blast furnace. The producer starts with raw materials like iron ore, coal, limestone, and steel scrap. The iron ore is reduced to iron using coal and reducing agents like coke. Then, the iron is converted to steel in a blast furnace, and finally cast, rolled, and/or coated for final delivery. As you’d expect from something called a “blast furnace,” it’s extraordinarily energy intensive to heat up and use.
Reused or secondary steel is usually made using an electric arc furnace (EAF). An EAF uses electricity to melt steel scrap. Other sources of metallic iron can also be included, and alloying materials are introduced to adjust the steel to the desired final chemical composition.
The table below shows how the steel industry relies on coal, electricity, natural gas, and oil to produce finished metal.
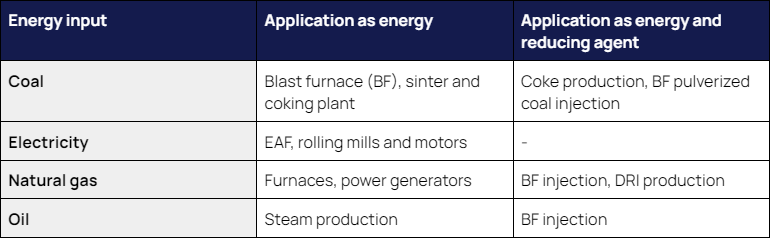
Source: World Steel Association
These inputs don’t just create greenhouse gasses, they also make up 20-40% of the total cost of steel production. Therefore, improvements in energy efficiency reduce production costs and improve competitiveness.
While vast amounts of heat and energy will always be required to produce steel, the source of that heat and energy can be transformed. Beyond that, creating primary steel is an inherently dirty job. Finding ways to recycle more steel, and creating a green electricity foundation to power the EAFs that create secondary steel is a clear priority.
The U.S. Department of Energy (DOE) has created a Low Emissions Steel Manufacturing Research Program to help foster decarbonization in the steel industry. Its pathways include:
- Alternative iron and steelmaking processes
- Hydrogen injection into the blast furnace and other existing processes
- Using clean energy sources
- Increased use of scrap metal
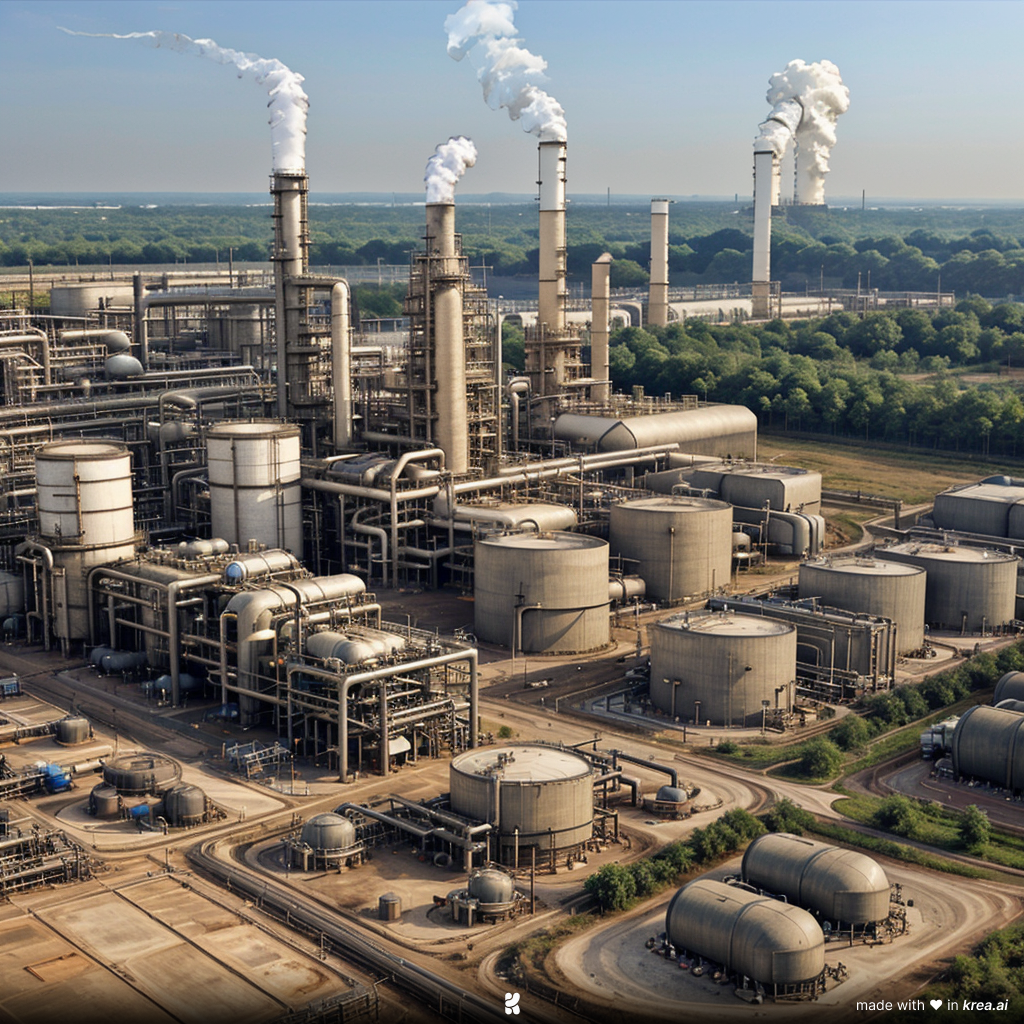
Energy use in chemical and petrochemical production
The chemical industry uses energy in two main ways: Fuel and feedstock.
Fuel is obvious. Converting chemical building blocks into useful chemical products takes vast quantities of energy. As high school chemistry students know, most chemicals in the world prefer to stay the way they are. It takes the application of heat or some other catalyst to force them to change.
Decarbonization of the fuel side of chemical production can be achieved through using less energy-intensive processes like advanced reactors, lower-carbon heating processes, and using lower emissions energy sources like hydropower and solar power.
Feedstock are the inputs used to create finished chemical products. Oil, gas, and coal are all precursors to everyday chemicals, as the graph below shows. Because much of the feedstock is incorporated into the final product, the chemical sector is the largest industrial energy consumer, but produces fewer CO2 emissions than iron and steel.
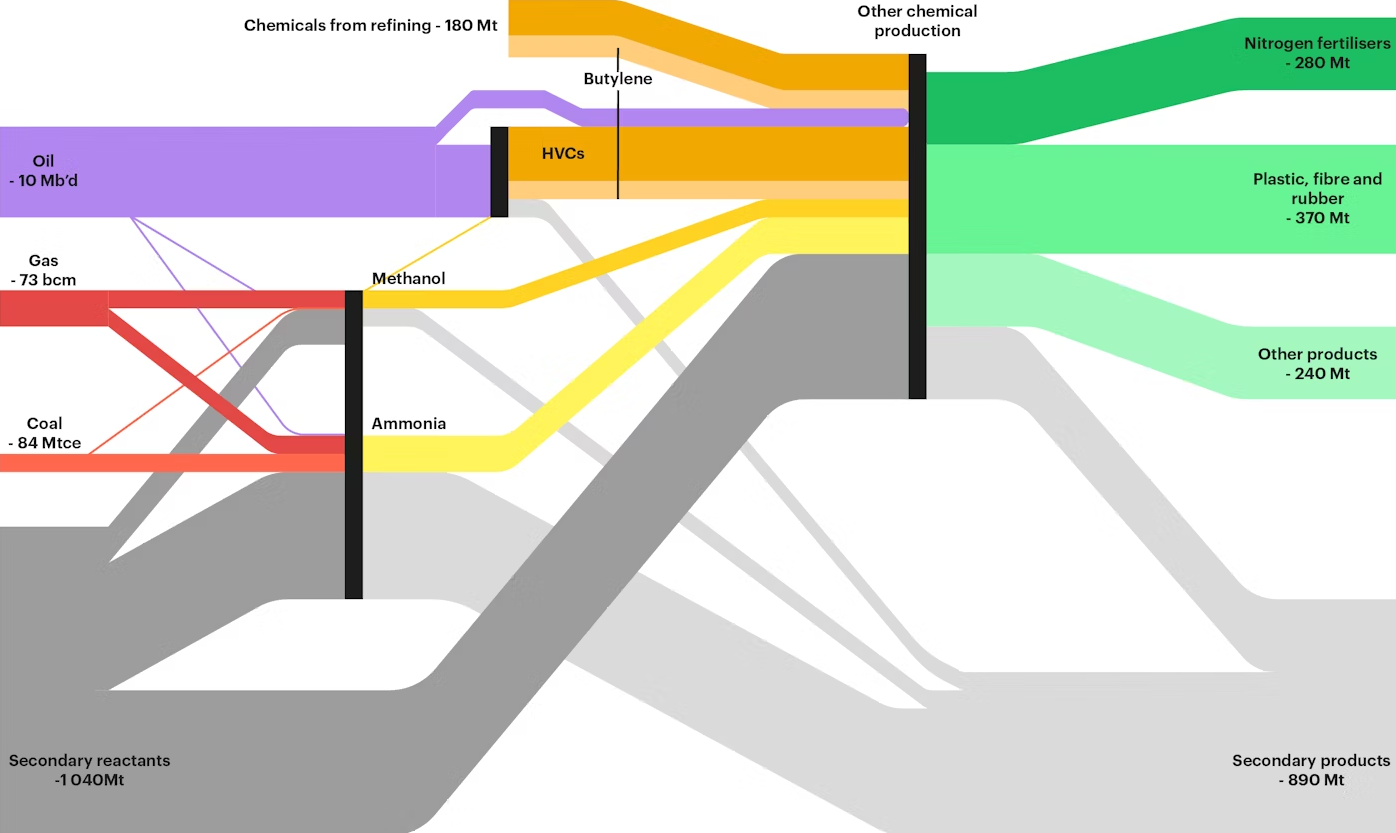
Source: International Energy Agency
Chemical producers and research institutions are trying to reduce their dependence on GHG-emitting feedstocks through sustainable chemistry. Sustainable chemistry is the design, development, and use of chemicals and materials that:
- Have lower energy consumption and emissions
- Are less toxic to humans and the environment
- Have reduced impact on natural resources
- Have lower waste and are easier to recycle
Programs like the International Council of Chemical Association’s Responsible Care initiative are also helping the industry get cleaner and cut emissions.
Energy use in food, beverage, and tobacco production
Perhaps no sector is as diverse in terms of inputs, outputs, and processes as food, beverage, and tobacco. But from factory farms the size of a city to your local corner bakery, they all require energy and they all produce GHG emissions.
Energy inputs include the electricity required for packaging, refrigeration or freezing, the fuel for onsite grinding and milling plants, and the heat needed to dry, steam, or bake food.
Because of the vast array of processes and operations sizes, decarbonization can take many forms. The largest source of emissions comes from heating, so a major focus is in finding ways to reduce carbon intensity in that process. Companies are looking at innovating in areas like:
- Steam generation and water heating technologies
- Waste heat recovery and reuse
- Electrification of heating (including induction, resistance, and infrared)
- Waste-to-energy systems
- Electrofuels and ammonia
- Integration of captured carbon into dry ice, cooling, and refrigeration
Interested in learning about one great way to make food and beverage manufacturing more efficient? Check out our insight on Manufacturing Operations Management Software for Food & Beverage. As Harvard Business Review recently noted, digital transformation is key to achieving sustainability goals in F&B.
Energy use in buildings
Energy use in buildings is responsible for 17.5% of all GHG emissions. Buildings need to be constructed, heated, cooled, and lit, and all of those processes use energy.
This challenge becomes more acute by the day. Global floor area keeps increasing, and rapid growth in living standards in developing countries means more air conditioners, heaters, and other appliances. Homes, HVAC systems, and appliances last for years. That means decisions made today will have a powerful impact on future emissions.
Governments around the world are implementing minimum performance standards and broader and more stringent energy codes. More efficient and renewable building technologies are being developed like residential heat pumps, integrated solar energy systems, and advanced air conditioning technology. But more will be required to bring the industry in line with net zero goals.
You can see which buildings in most countries are sustainable for yourself by looking for a LEED plaque. LEED (Leadership in Energy and Environmental Design) is the most widely used green building rating system in the world. Buildings that achieve LEED status have environmental, social, and governmental goals baked into their design and construction.
Energy use in transport
Transportation is a major component of world GHG emissions. And most of those emissions come from oil. Gasoline, jet fuel, and petroleum distillates account for almost 90% of the transportation energy in the United States, with similar statistics abroad.
- Gasoline is used in cars, motorcycles, light trucks, boats, and some types of aircraft.
- Distillate fuels are used by trucks, buses, trains, boats, and ships.
- Jet fuel is used by jet airplanes and helicopters.
- Biofuels are added to gasoline and diesel fuel.
- Natural gas is used in cars (usually in large government or private fleets), buses, trucks, and ships, as well as in the compressors that move natural gas through pipelines.
- Propane is used in fleet vehicles
- Electricity is used in EV vehicles and public mass transit systems
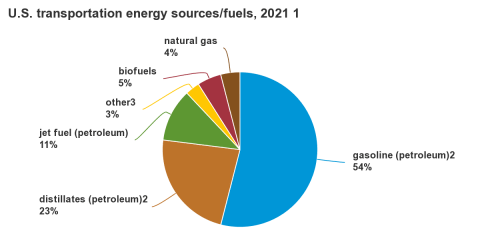
Source: U.S. Department of Energy
Stanford University has identified six key opportunities for decarbonizing and improving transportation:
- Design for less transportation with walkable and bikeable cities, remote learning and work, domestication and near-shoring of supply, and reduced consumption.
- Optimize the overall transport system by moving from carbon-intensive modes of transportation like individual cars, trucks, and planes to less carbon-intensive modes like public transport, rail, and biking.
- Promote behavioral change toward walking and biking when possible, using smart delivery instead of express delivery to reduce air demand.
- Electrify and transition to cleaner fuels like sustainable aviation fuel, green methanol for shipping, and hydrogen.
- Adjust gasoline, diesel, and jet fuel prices to reflect their social and environmental costs through methods like a carbon tax.
- Develop smart transport through the use of data analytics, AI, and IoT devices to optimize routing and reduce fuel consumption.
Agriculture, forestry, and land use
We need food to live. But food production creates greenhouse gas emissions that are warming the planet up to uninhabitable levels. Most GHG emissions from agriculture, forestry, and land use come from livestock and manure, agricultural soil production, and crop burning. By understanding and targeting each segment, we can substantially reduce global GHG emissions.
Across types of farming, associations like the American Farm Bureau Federation are working to create a more sustainable future for agriculture. The AFBF is currently working across climate smart farming, carbon markets, renewable energy, agricultural research, and building partnerships in sustainability.
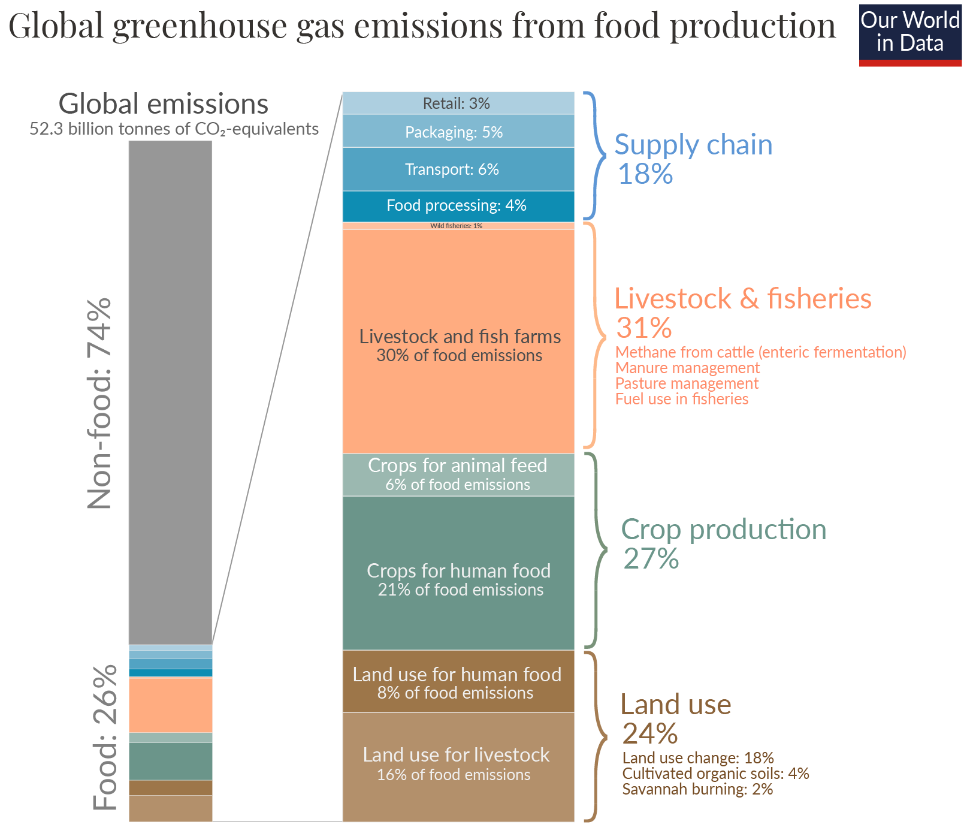
Source: Our World in Data
Livestock and manure
While the image of farting cattle warming our atmosphere is ingrained in the popular imagination, it is far from the whole picture. Major sources of GHG emissions from livestock production include:
- Enteric fermentation: Cattle and sheep produce methane through their digestive process. Surprisingly, over 90% of it is emitted via burping. This is the largest source of livestock emissions.
- Manure: Solid waste produces methane and nitrous oxide. Liquid storage like “manure lagoons” emit the highest amount of GHG gasses.
- Feed production: Fertilizer and feed production emits CO2 and fertilizing crops generates nitrous oxide emissions.
- Land use change: Converting forest, grassland, and other natural environments into cropland and pastures releases the CO2 stored in biomass and soils.
- Processing: Emissions created from slaughtering, processing, and packaging livestock are usually included in global estimates.
Agricultural experts around the world at places like the University of California, Davis are working hard to reduce livestock GHG emissions.
Researchers and producers are developing and adopting technologies and practices like methane-reducing feed additives like red seaweed and breeding low-methane cattle that emit far less methane per pound of beef.
Adapting our land use helps keep CO2 locked away in biomass and soil. Livestock productivity improvements like improved cattle breeding, pasture management, crop-based feeds, and improved vet care are helping on the demand side of land use. On the supply side, governments are developing and enforcing stricter land use policies.
Finally, the only way to flatten the emissions curve over the long term is to lower the demand for meat per person. Moving from beef to poultry and fish, promoting largely vegetable based diets, and developing alternative proteins like plant-based meat are all ways to reduce the agricultural carbon footprint of each consumer.
Agricultural soils
Soils are both sources and sinks for GHG emissions.
When used for agriculture, management of agricultural soils can lead to more nitrogen being placed in the soil, leading to greater emissions of nitrous oxide. These management practices can include applying fertilizers (both synthetic and organic), growing nitrogen-fixing crops, and irrigation practices.
Other soil management practices like irrigation, tillage, and fallowing can increase and decrease the amount of CO2, carbon monoxide, and methane the land sinks or stores. However, these can be difficult to measure, so most carbon footprint models only estimate the emissions from fertilizer use.
GHG emissions from agricultural soils can be mitigated by carefully fertilizing crops with only the appropriate amount of nitrogen, and draining water from wetland rice soils during the growing season to reduce methane emissions.
Crop burning
Traditional agricultural practices often include burning crop residues like straw and stems in the fields they were planted in. This releases methane and nitrous oxide emissions into the atmosphere. Further advances in policy and practice in countries such as India and China, encouraged by international organizations like the UN Food & Agriculture Organization should help reduce its outsize impact on global emissions.
Industry
We’ve covered GHG emissions created by energy use in industry above. However, two industries, chemicals and cement, also create GHG emissions through the processes they use to make their finished products.
Chemicals
Decarbonizing the chemical industry poses a unique challenge, as unlike most other sectors, many of its emissions are not caused by the combustion of fossil fuels. Changing the feedstock used to create chemical products and the gasses used for chemical processes requires more creativity, including using recycled materials, captured carbon, and other reduction agents.
Greenhouse gasses are released when natural gas and petroleum feedstocks are converted into finished products. For example, olefins like ethylene, propylene, and butadiene are critical precursors for plastics, detergents and coatings. But creating them involves natural gas liquids like ethane. The entire process is energy and carbon intensive.
By capturing and converting sustainable feedstocks like waste gasses, biomass, renewable natural gas, and hydrogen, the chemical industry can make progress towards a net zero future.
Cement
Humanity makes more concrete than any other material on earth, and the growth of large developing nations like China and India means that amount keeps increasing.
Cement, the binder that holds the sand or crushed stone in concrete together, is incredibly energy-intensive to produce. Limestone must be baked in enormous kilns at very high heat, usually by fossil fuels, and CO2 is released as a by-product. Each kilogram of cement releases one kilogram of CO2.
Scientific American released a report last year looking at each step in the cement and concrete production chain, and condensing how each step could be made less carbon-intensive. From better precursor materials (basalt instead of limestone, oxygen-rich air to reduce emissions, adding mineralizers), to more electrification (electrifying steps in the process to allow for reliance on the power grid’s green power sources, EV transport instead of gas-powered), to better building codes and end-of-life planning, one of humanity’s dirtiest processes can get cleaner by the day.
Organizations like the Global Cement and Concrete Association are putting these recommendations in place through worldwide standards and certifications to help build a net-zero future.
How can my business reduce its GHG emissions?
If you work in one of these industries, you’re probably already looking at emissions from your own processes as well as those from your supply chain. It’s a complicated job, full of complex calculations, piles of paperwork, and plenty of scope for human error.
The Glassdome Product Carbon Footprint platform simplifies sustainability, with cutting-edge software and the guided expertise to help you master it.
Sound interesting? Just have a question about GHG emissions in your industry? Get in touch. It’s one small step for your company. But one giant leap for a cooler world.

Mfg 2024.04.03
What can Manufacturing Operations Management Software do for Food & Beverage Manufacturers?
News 2024.03.25
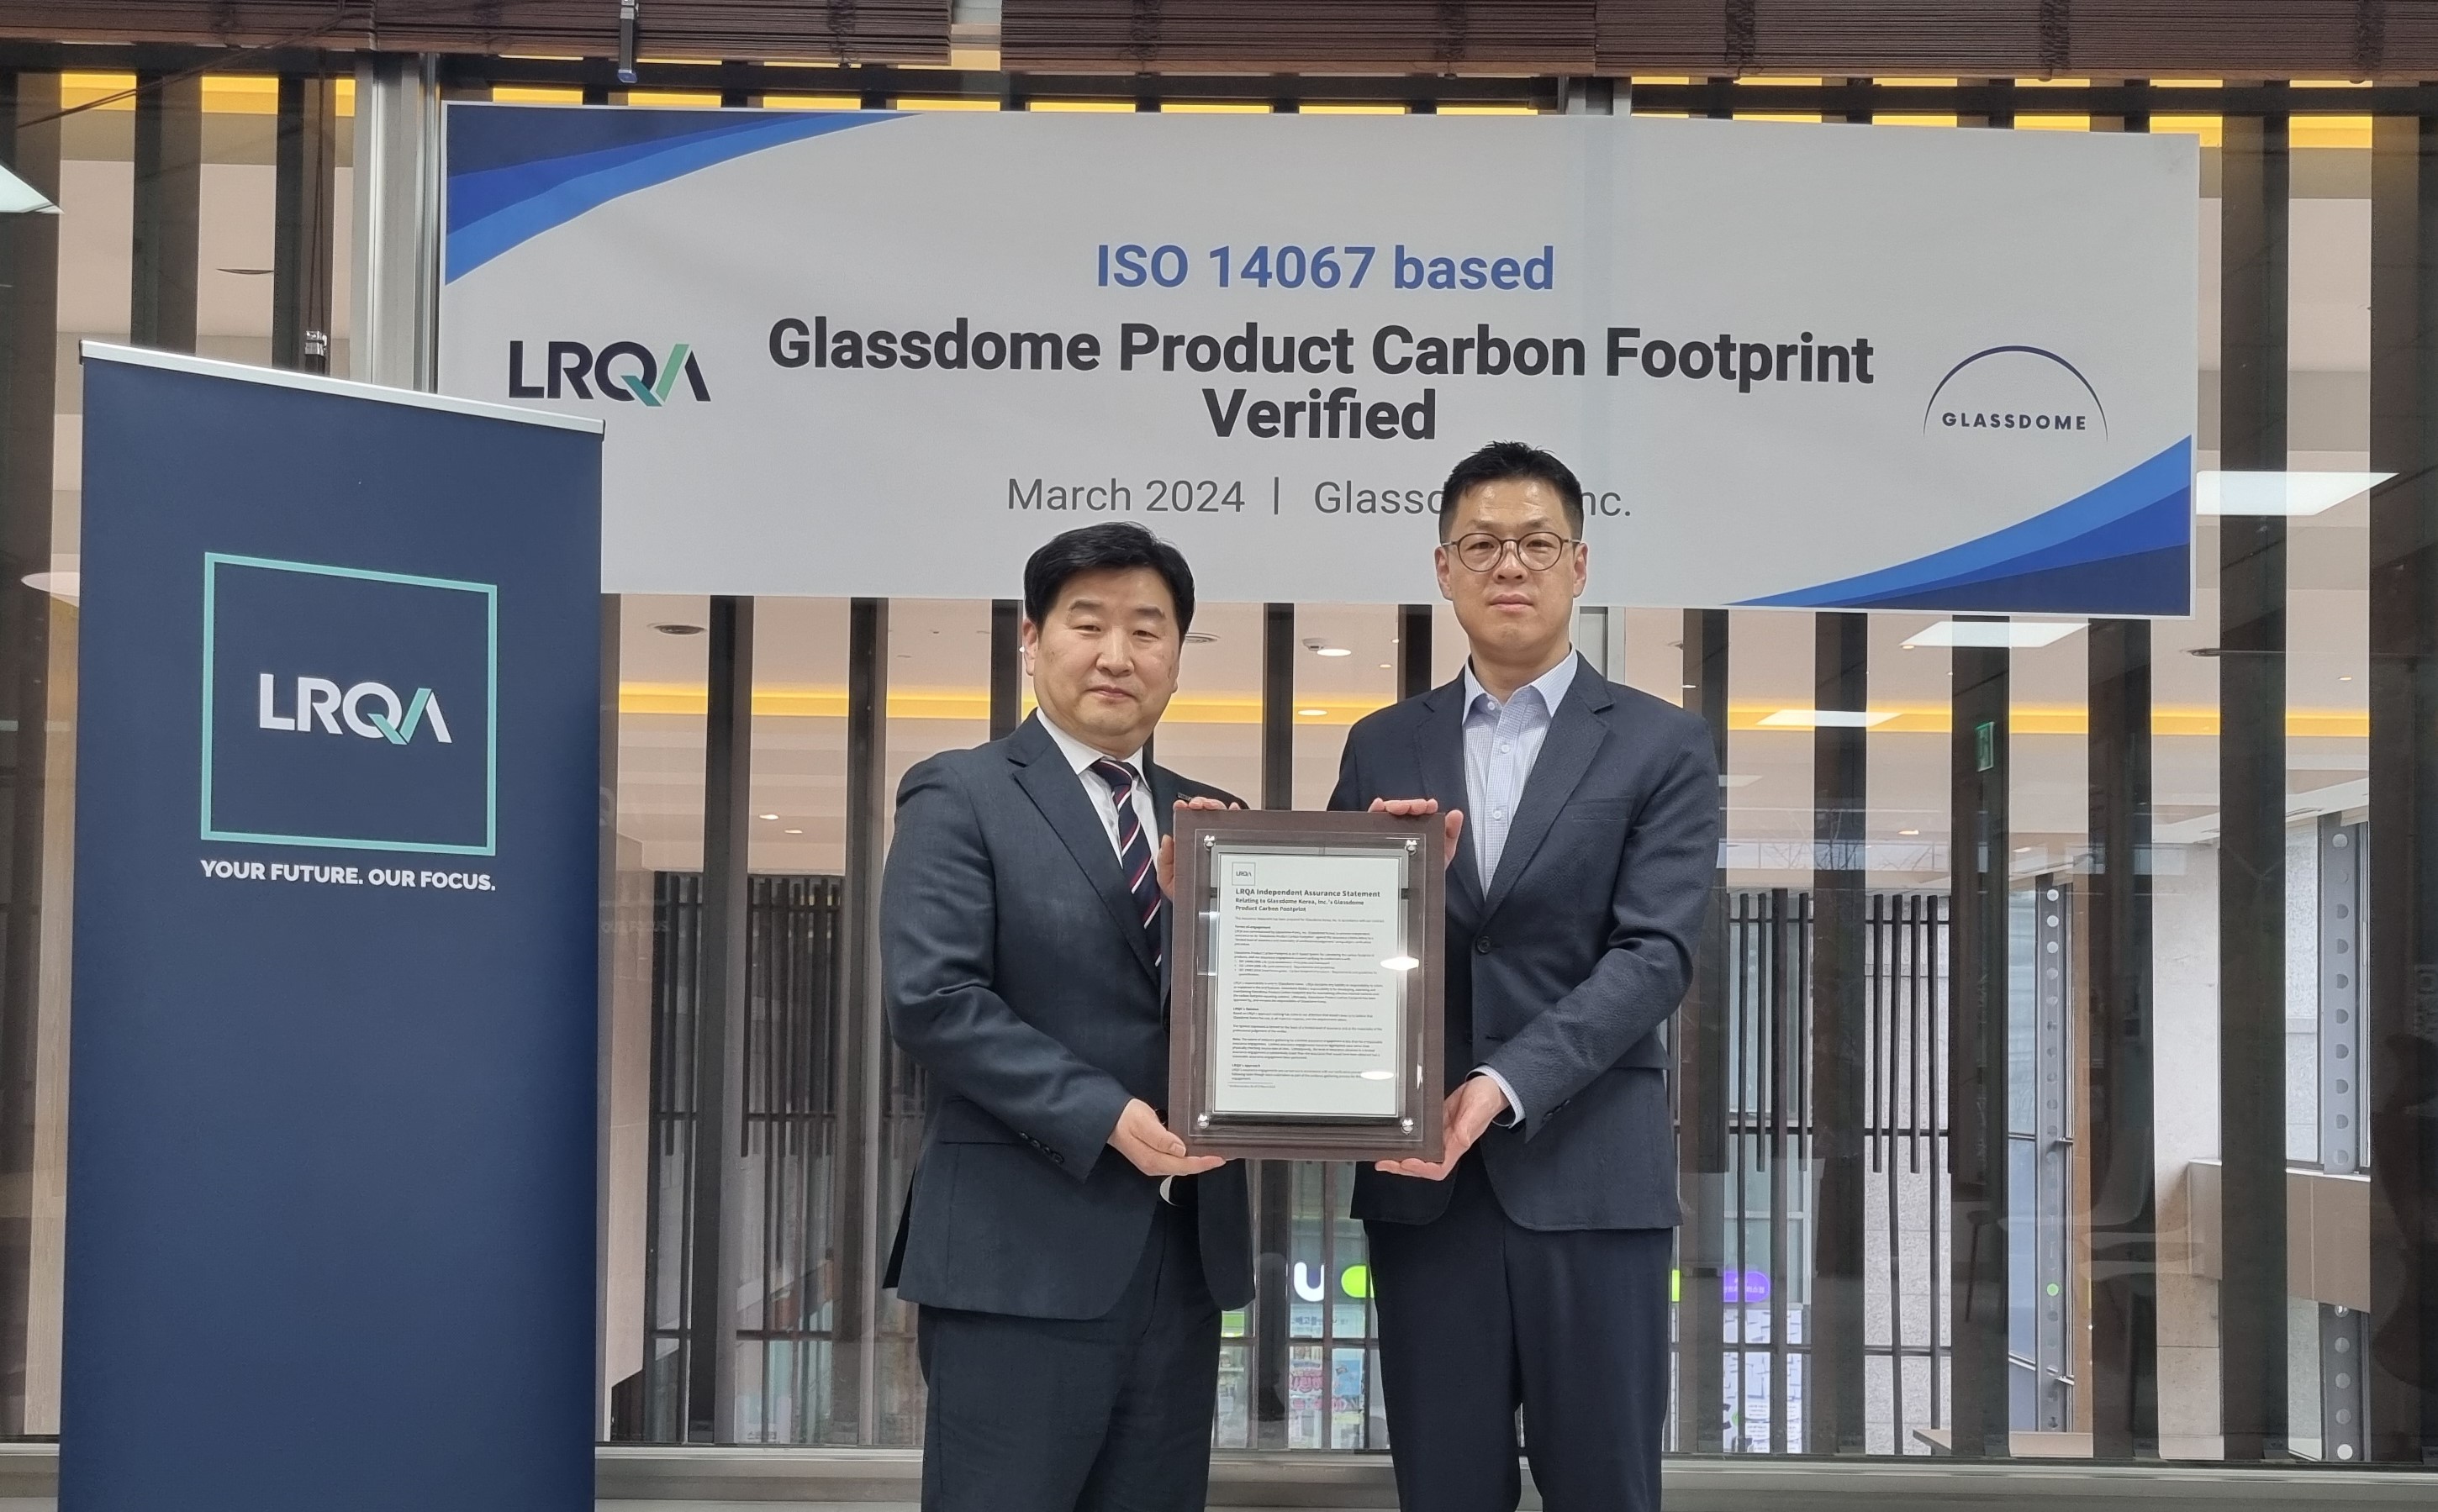
Glassdome Completes the ISO 14067 International Standard Verification for Product Carbon Footprint Assessment from LRQA
PCF 2024.03.19
What do new EU regulations mean for battery manufacturers and importers?
The European Union (EU) Battery Regulation 2023/1542 is key to the EU’s efforts to address environmental concerns, promote sustainability, and enhance energy security. Enacted on January 1, 2023 and planned to be implemented in Q2 2024, this regulation covers the entire battery lifecycle. It sets out ambitious targets and requirements from production to disposal to mitigate the environmental impact of batteries and foster the development of a circular economy. If you import batteries to the EU, you need to know its ins and outs.
Background
This new regulation replaces the Battery Directive (2006/66/EC), and will come into effect 12 months after the act passes. In the next few years more and more new requirements will come into effect that will directly impact battery manufacturers and their supply chain.
The driving force behind the new regulation is the 2019 announcement of the European Green Deal, a growth strategy that targets zero net greenhouse gas emissions by 2050. The end goal is to decouple economic growth from resource use and ensure that products marketed and sold in the EU are sourced and manufactured in a sustainable way.
The critical role batteries play in the overall green transition, from transportation to energy storage to digital transformation, makes them a key target of regulators. Although batteries are a cornerstone of sustainable development, their product lifecycle has not always been particularly clean.
Overview
The EU Battery Regulation is designed to promote the circular economy: encouraging the reuse, recycling, and recovery of battery materials. It establishes stringent requirements for the collection, treatment, and recycling of batteries. Manufacturers are required to design batteries with recyclability in mind, ensuring that they can be easily disassembled and their components recovered. Additionally, the regulation sets recycling targets for different types of batteries, incentivizing manufacturers to invest in recycling infrastructure and technologies.
The regulation addresses the environmental and social impact of battery production by imposing strict sustainability criteria on battery manufacturers. Manufacturers need to comply with environmental and social standards throughout their supply chains. By promoting sustainable sourcing and ensuring supply chain transparency, regulators aim to reduce the environmental footprint of battery production and mitigate human rights abuses associated with mineral extraction.
Beyond sustainability goals, the EU Battery Regulation aims to enhance the safety and performance of batteries. Faulty or improperly designed batteries are a consumer risk. The regulation establishes standards for battery safety and performance, including requirements for labeling, testing, and certification.
Finally, the EU Battery Regulation addresses the issue of battery waste management by establishing a comprehensive framework for the collection, treatment, and disposal of batteries. Manufacturers will assume responsibility for collecting and recycling of batteries, either individually or through collective schemes. Additionally, the regulation encourages the development of innovative recycling technologies and processes to maximize the recovery of valuable materials from spent batteries.
Specific Requirements and Timeline
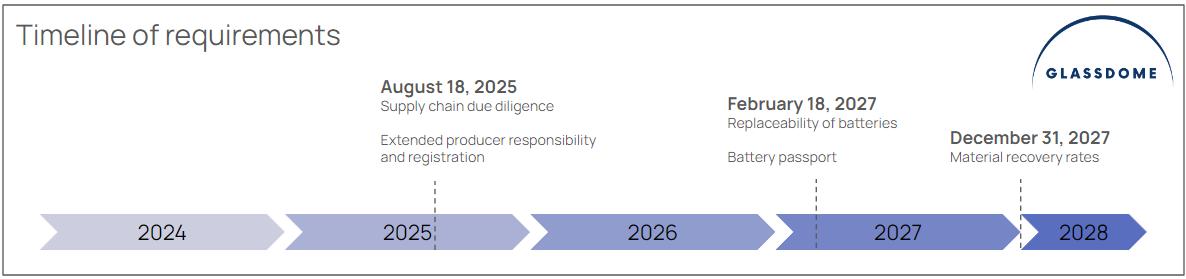
*This timeline is subject to change based on when (or whether) the implementing act passes.
CE Conformity Assessment
To be traded freely in the EU, most goods need a “CE” (conformité européenne) mark. The mark affirms that goods are compliant with EU regulations.
The new regulation makes batteries one of these CE goods. All batteries, whether in a product or sold standalone, will need the mark.
In most cases the battery manufacturer needs to handle the CE conformity assessment. Different types of batteries have different requirements. The five categories are:
- Portable batteries
- Light means of transport (LMT) batteries
- Starting, lighting, and ignition (SLI) batteries
- Industrial batteries
- Electric vehicle batteries
Manufacturers can self-certify small portable and industrial batteries (under 2 kWh). For all other batteries, a separate certification body will need to be involved.
The CE conformity assessment and marking requirements will start to apply on August 18th, 2024. Related carbon footprint and recycled content requirements will be added at a later date.
Those requirements will be:
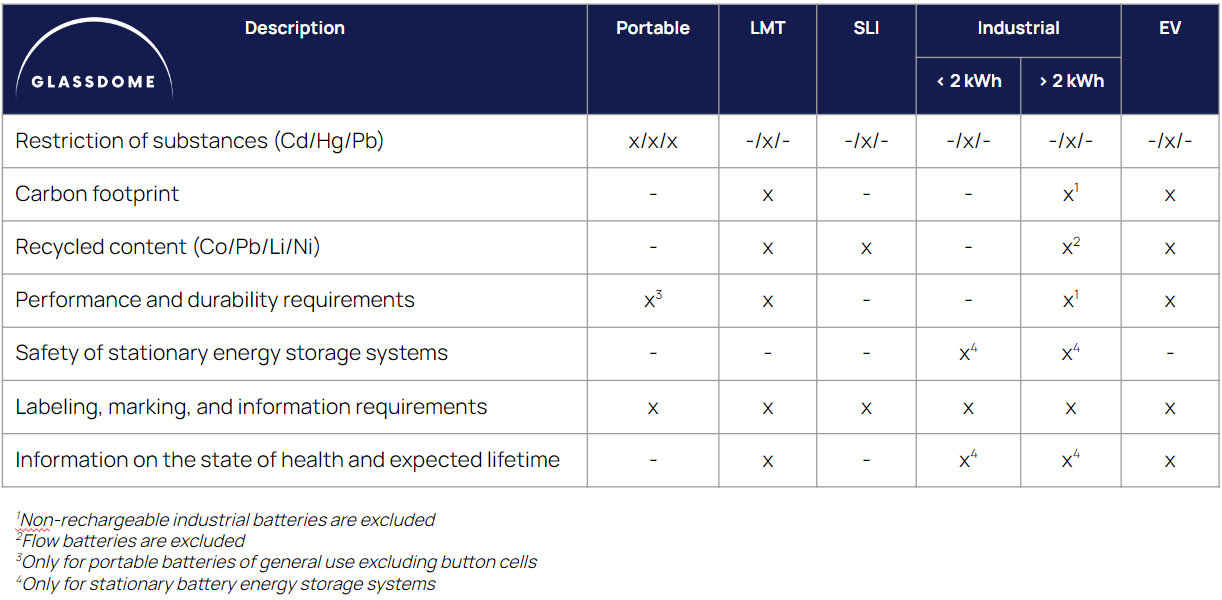
You’ll notice that carbon footprint calculation is a major component of the new regulation for EV, LMT, and certain industrial batteries. The EU has mandated six requirements for battery Carbon Footprints.
Each category of battery has its own carbon footprint timeline, moving from initial carbon footprint declarations to performance class declarations, to carbon footprint threshold beginning to apply. EV and LMT battery manufacturers should take note that the footprint calculations and performance class declarations will need to be conducted before the passport is required.
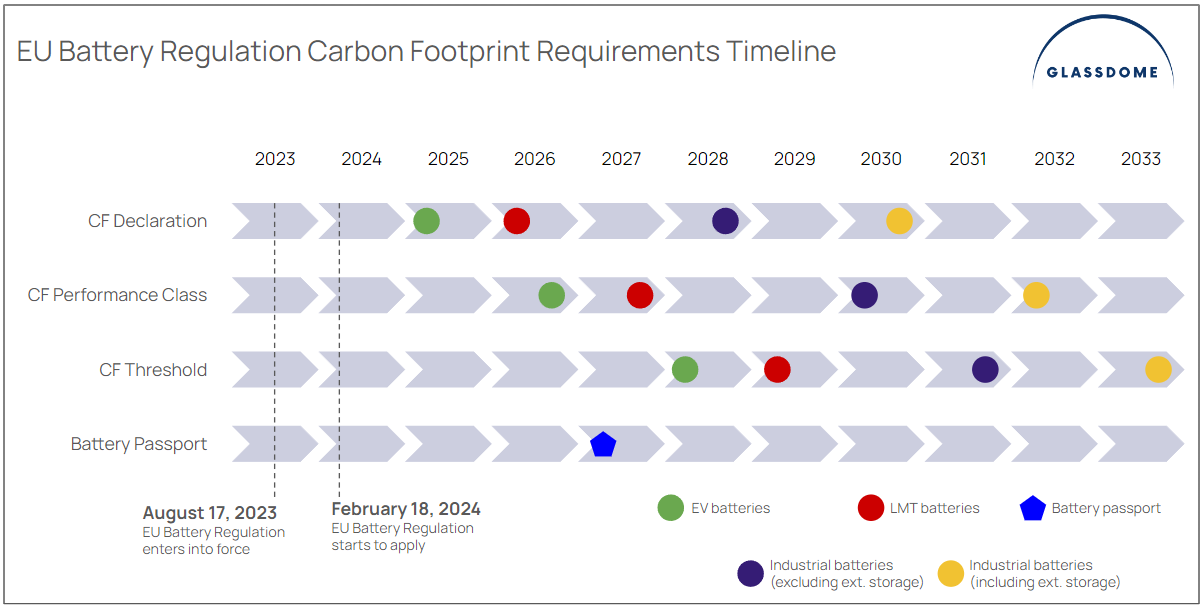
*This timeline is subject to change based on when (or whether) the implementing act passes.
Supply chain due diligence
Companies will be required to complete supply chain due diligence for batteries that contain cobalt, natural graphite, lithium, or nickel. Companies with a net turnover of less than €40mm that aren’t part of a larger corporate group are exempt.
To complete supply chain due diligence, companies must:
- Adopt and communicate a due diligence policy
- Establish strong supporting management systems
- Identify and assess upstream supply chain risks
- Design and put in place a policy to respond to those risks.
Third-party verification of these policies and their implementation will be required. Supply chain due diligence starts to apply on August 18th, 2025.
Extended producer responsibility and registration
The new regulation updates existing producer responsibility and registration requirements.
Extended producer responsibility means that companies that bring batteries to market in the EU are responsible for their end-of-life collection and treatment. The updates introduce new targets for collection rates and recycling efficiency.
The extended producer responsibility and registration requirements will also begin to apply on August 18th, 2025.
Replaceability of batteries
New requirements obligate electronics producers to make sure that portable batteries are easy to remove and replace by the end user. LMT batteries and cells in those batteries are required to be easy to remove and replace by independent professionals.
These battery replaceability requirements will begin to apply on February 18th, 2027.
Battery passport
One of the most complex pieces of new regulation is a requirement for an individual electronic battery passport for several types of batteries. These include:
- Industrial batteries over 2 kWh
- EV batteries
- LMT batteries
The battery passport will include general information about the battery and a product and sustainability data sheet.
The goal of the battery passport initiative is to strengthen supply chain transparency and quicken information exchange across each battery sample. The passport will be available through a QR code on each battery.
The battery passport requirement begins February 18th, 2027.
Glassdome is already working with our partners at the Global Battery Alliance to help some of the world’s leading battery manufacturers get ready for the battery passport era.
Material recovery rates
The final piece of the regulatory puzzle to come into effect are targets for material recovery of cobalt, copper, lead, lithium, and nickel in battery recycling and treatment facilities.
These targets will start to apply starting December 31st, 2027.
Looking ahead
The EU Battery Regulation 2023/1542 represents a significant step forward in the EU's efforts to promote sustainability, enhance energy security, and address environmental challenges. It sets a precedent for global efforts to promote sustainable battery production and consumption, paving the way for a more environmentally friendly and socially responsible future.
Need help getting ready for this new era of regulation? Glassdome can help. We’re already working with some of the world’s largest battery producers and their suppliers to build a strong compliance and reduction foundation. Drop us a line on our site, or email us at info@glassdome.com. You’ll be glad you did.

News 2024.02.05
Glassdome, together with SK C&C, establishes a Digital Carbon Passport platform based on Life Cycle Assessment (LCA) at Lotte Aluminium and Choil Aluminum.

Mfg 2024.01.15
Why Does Manufacturing Need to Change?
Manufacturers are at an inflection point. Making things and getting them to where they need to be is far more complex than it once was. While manufacturing moves from developed countries to new frontiers, supply chains grow more and more volatile. How can modern manufacturers understand and adapt to these changes?
What’s happening to manufacturing in developed countries?
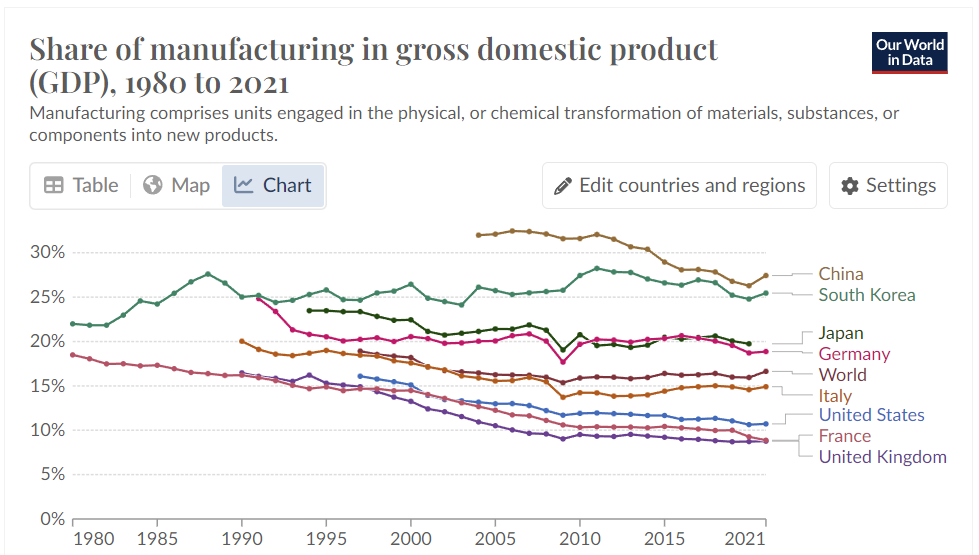
Since the late-20th century, manufacturing's share of worldwide value creation has been decreasing. According to the World Bank and OECD, the global share of manufacturing in GDP has decreased from 18.9% in 1997 to 16.6% in 2021 (see chart).
This decline in manufacturing’s importance to the global economy began in leading developed countries. Deindustrialization has been clearly evident in the United States, Europe, and Japan for some time. Recently, it has also been observed in the Four Asian Tigers – South Korea, Singapore, Hong Kong, Taiwan – as well as in China.
In the United States, manufacturing decreased from 16.1% in 1997 to 10.7% of GDP in 2021. In South Korea it decreased from 27.6% in 1988 to 25.5% in 2021. Manufacturing’s share of GDP is falling even in major manufacturing nations like Germany, Japan, and China.
Are developed countries just “hollowing out?”
In addition to deindustrialization, much of this decline in developed countries can be attributed to offshoring, leading to a phenomenon called "hollowing out." This is when manufacturing facilities move to countries with lower labor costs, resulting in a decline in the manufacturing workforce in the original country. In a social context, it can be dangerous as middle-class jobs disappear, wealth concentration increases among the affluent, and the low-income population grows.
This isn’t a case of self-centered manufacturers looking for marginal gains on their balance sheet. The IMF notes that this decline in the manufacturing share of the overall economy is considered a natural occurrence as the entire economy develops. The fact that consumption expenditures on manufactured goods have remained relatively stable over the past few decades supports this argument.
However, despite these factors, it is undeniable that the traditional manufacturing-centric industrial structure is undergoing a revamp, and manufacturing’s share of the developed world’s economy is decreasing.
Supply chain challenges
The global supply chain has become historically volatile. The Global Supply Chain Pressure Index (GSCPI), which measures the status of the global supply chain by integrating transportation cost data and other manufacturing-related indices, has fluctuated wildly in recent years. This instability is due to trade tensions between the U.S. and China, a worldwide spike in protectionism, and, of course, the COVID-19 pandemic.
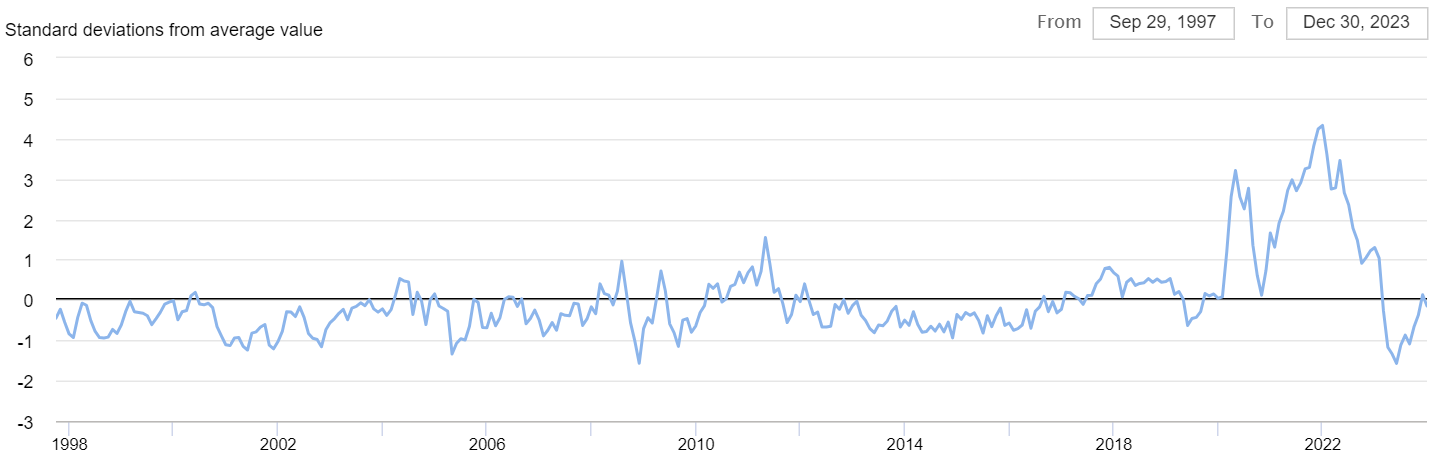
Global Supply Chain Pressure Index
How can the manufacturing industry strengthen its competitiveness to overcome these challenges?
Deindustrialization and global supply chain volatility are challenging the manufacturing industry. Without a system that can adapt flexibly to these shifts, the sector may face even greater crises.
That’s why Digital Transformation is the hottest topic in manufacturing innovation.
Digital Transformation (DX) refers to the process of introducing and operating digital technologies to develop new products and innovate existing products or operations. This includes cutting-edge tech like the Internet of Things (IoT), cloud computing, Artificial Intelligence (AI), and big data solutions. Digital Transformation is designed to improve efficiency and customer experiences and create additional value through innovation and new inventions.
The COVID-19 pandemic acted as a catalyst for Digital Transformation. A survey in 2020 showed that 37% of European companies and 27% of U.S. companies had not adopted digital technologies, but in 2021, 55% of European companies felt the need to adopt digital technologies due to the pandemic, and over 46% increased their investments in digital technologies.
Manufacturers have their own subset of DX: Industrial Digital Transformation (iDX). iDX is the process of addressing industrial challenges and creating new value by integrating digital technologies such as cloud computing, big data analysis, AI, and 5G throughout the entire industrial process.
iDX can be broadly organized into four categories: process innovation, product intellectualization, service enhancement, and the creation of new industries and business models.
The future
Despite its promise, Digital Transformation is not progressing as rapidly as expected. While almost all companies have started DX projects in some form or at some level, most are struggling to fully complete the initiative and embed Digital Transformation in their DNA.
Companies and governments worldwide are implementing various policies to promote the Digital Transformation of industries. In future insights, we’ll explore the DX promotion policies of different countries and regions.
Looking to implement iDX in your factory to make it more efficient and increase visibility and productivity? Look no further. Our Manufacturing Operations platform is the best way to cut downtime and raise quality.


Subscribe
Enter your email address to subscribe to the Glassdome Sustainable Manufacturing Blog
This site is protected by reCAPTCHA and the Google
Privacy Policy and
Terms of Service apply.